Balloon Mapping: documenting the Gulf Coast oil spill and student protests in Chile
 When activists are talking but no-one is listening, hard evidence is often needed to back up the words and demand attention. But that evidence can be difficult to find and verify, and sometimes it falls on the activists themselves to create the documentation they so desperately need.
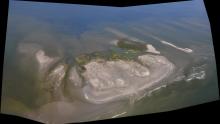
In 2010, a community monitoring project in New Orleans led by an activist group called the Louisiana Bucket Brigade got Gulf Coast residents out on boats and beaches to produce high-resolution aerial imagery of the effects of the BP oil spill, which had happened earlier that year.
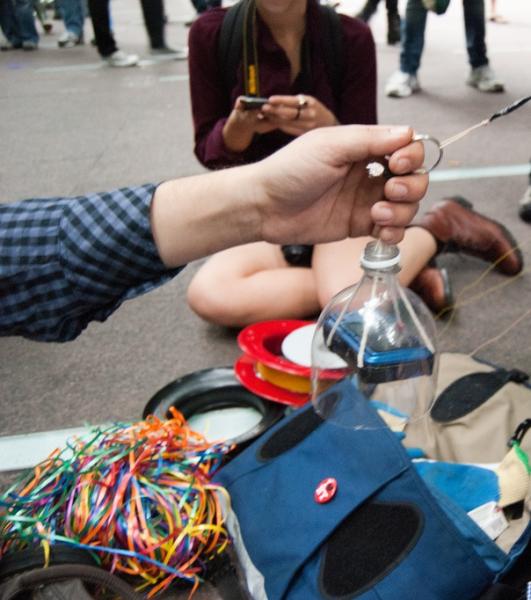
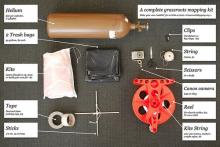
Their satellites? Cameras mounted on helium balloons. Once the images were captured, they were stitched together to create an aerial map.
'Balloon mapping' began out of people's frustration at the lack of publicly-available visual documentation of the BP spill, combined with a dismal lack of transparency and accountability on the part of BP. At the time, BP was coordinating with the Coast Guard to restrict access to affected areas.
In order to prevent the oil giant from having total control over how the spill was represented, it therefore became critical that an independent, citizen-led monitoring effort be undertaken. All the data collected by the project was released into the public domain.
A year later, the Chilean Fundacion Ciudadano Inteligente (Smart Citizen Foundation -- SCI) used the same methods to provide an alternative perspective on Chile's 2011 student protests. While mainstream media attention honed in on the violence and damage to public property that occurred, SCI wanted to show the bigger picture: a largely peaceful demonstration. SCI adapted the balloon mapping technique by setting up a live stream of events through a smartphone dangling from a cluster of balloons.
Elizabeth Wolf from SCI explains: “We wanted to demonstrate and strengthen the perspective of viewing protests from the citizen’s point of view, in order to broadcast to the world the majority, rather than the minority of the behavior of the attendees of these events. We wanted to show a grassroots movement from a truly grassroots perspective.”
Two years after the Gulf Coast mapping project ended, some of the participants set up a website called Grassroots Mapping, which offers support for others who want to do balloon mapping. The website provides guides and case studies, as well as its own open-source tool, 'MapKnitter', for stitching together aerial photos.
FURTHER READING
Balloon mapping in Santiago: seeing protests from a different perspective, Grassroots Mapping, 2011.
Grassroots mapping: tools for participatory and activist cartography, Thesis by Jeffrey Warren, 2010.
Public Laboratory's guide to balloon mapping.
VIDEO
PlaceMatters launches a test balloon with an iPhone attached.


